There are 5 Tuna commissions, that fish in the designated open ocean territories listed below.
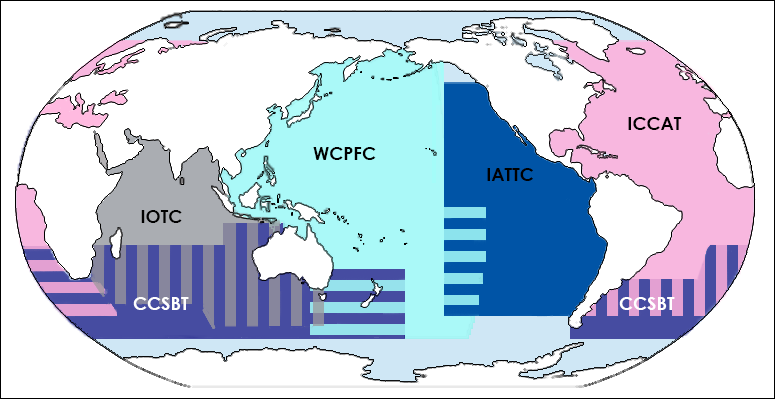
These fisheries often catch organisims that were not their intended target. These unintended targets are known as bycatch.
My data visualizations made this quarter cover various aspects about this bycatch in more detail.
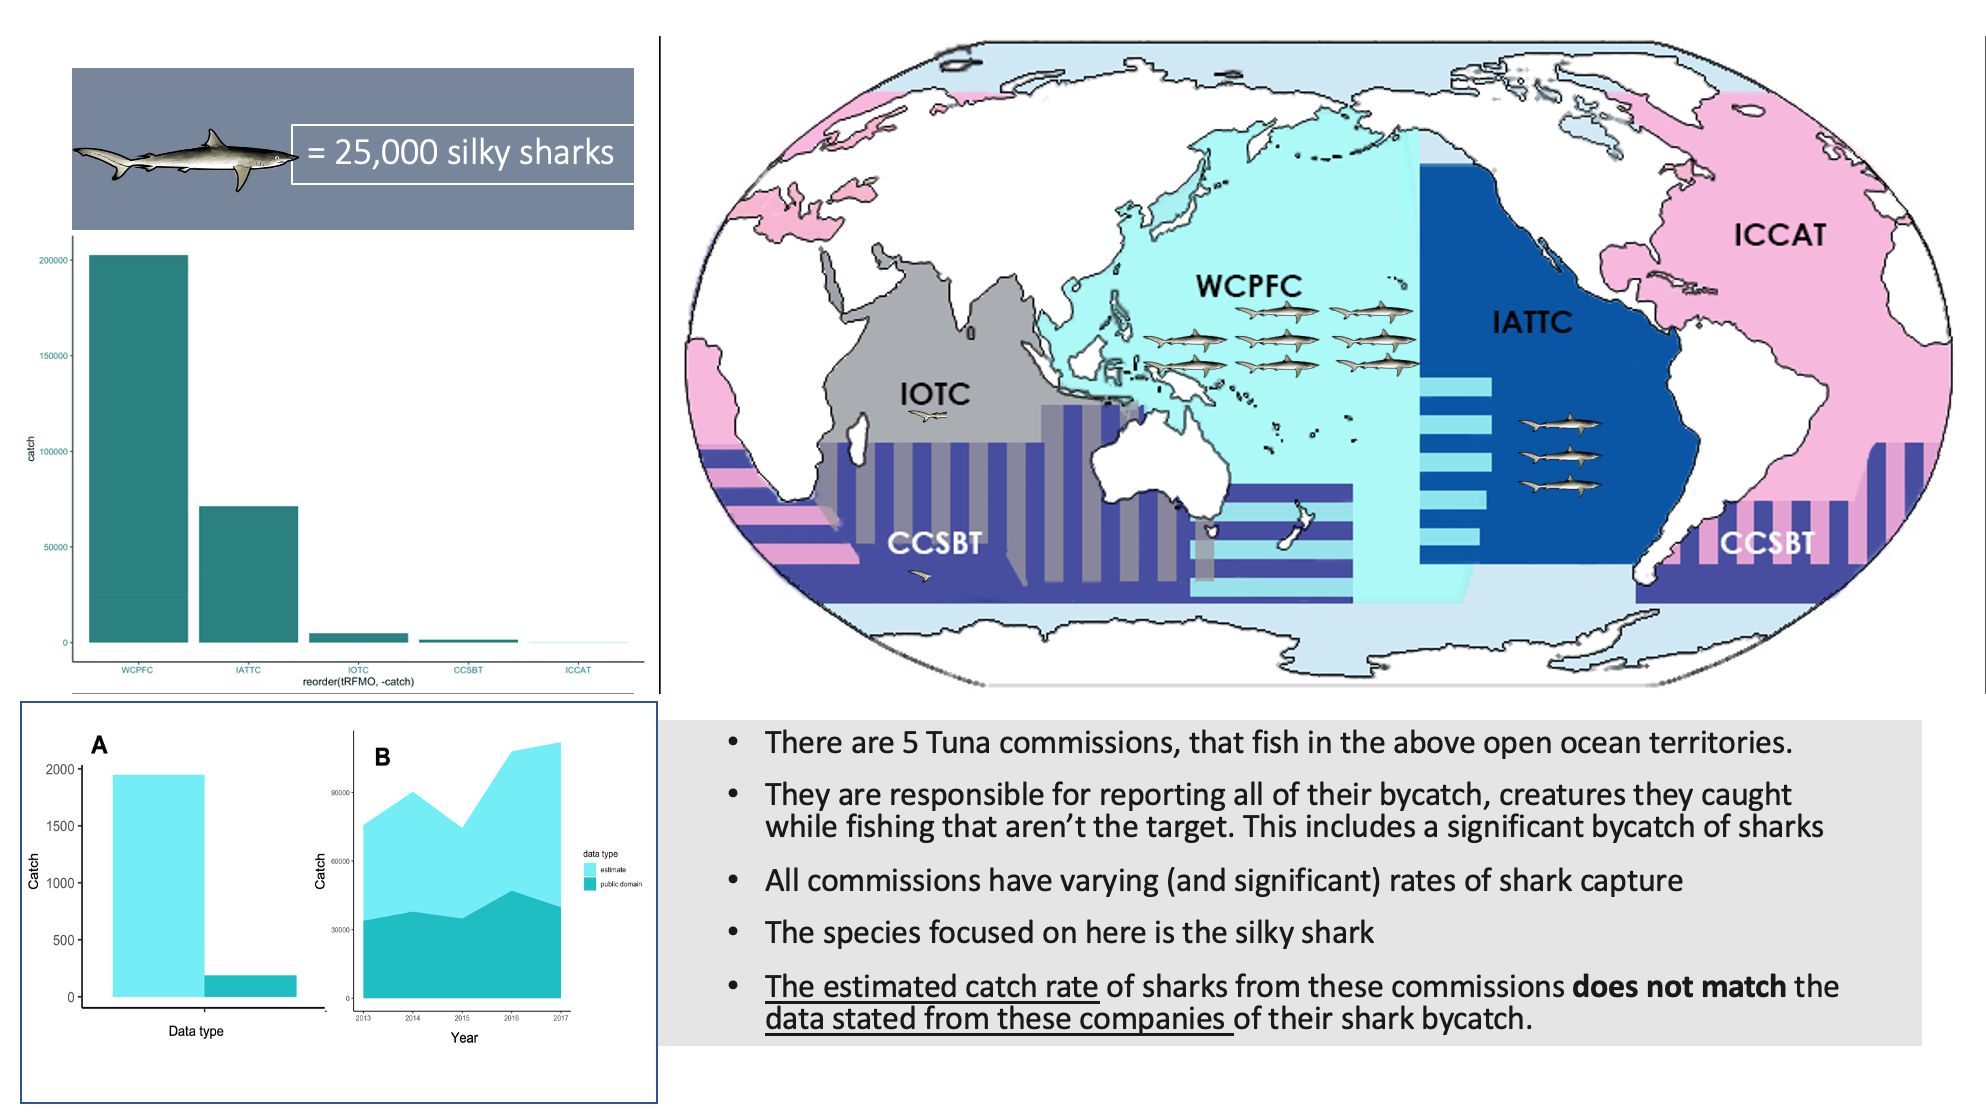
A basic run down of the implications of the data—that the estimated catch rate of by catch from these commissions does not match the data stated from these companies of their bycatch—with only one of the affected species (Silky shark) illustrated and highlighted. I used interesting power point transitions to liven up the presentation. I also made the map at a later point.
I used a free, pre-rigged 3d model of a shark from the site turbo squid (thank you to user Flytet) and the animation software Blender to animate a short that illustrates how creatures such as sharks get caught as bycatch. Bycatch usually occurs for sharks and rays by hunting within the perimeter of a fishing net that has been widely cast, with a bottom that draws closed in order to trap the fish, resulting in the shark being dragged up with it.
(Note: the great white shark is NOT one of the affected species in our data, despite it being reflected in the animations model)
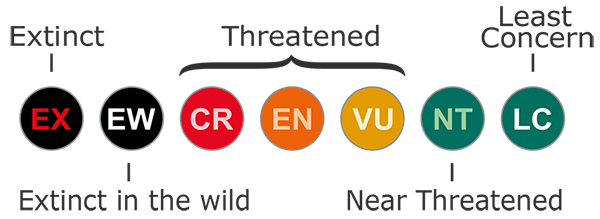
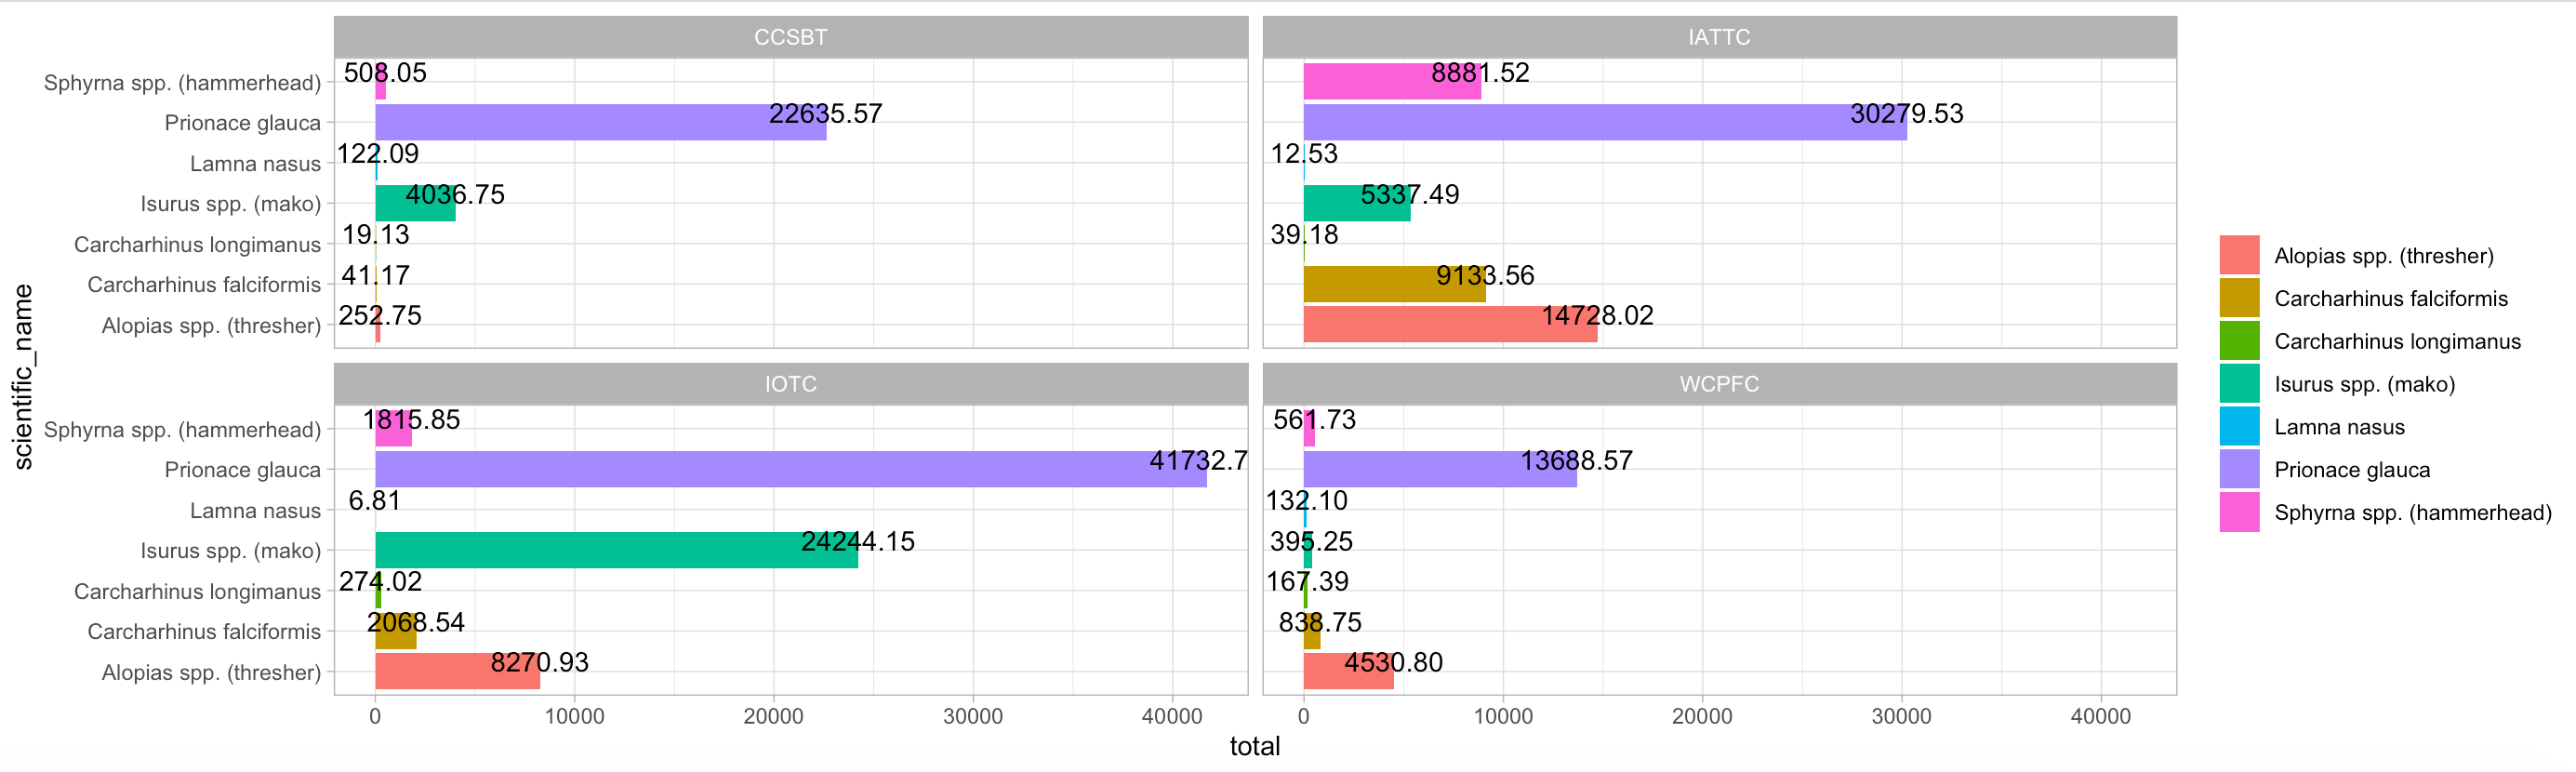
I used the software R studio and ggplot to take CSV data of the number of affected species landed or discarded in the IATTC region, and turn it into a graph. I also used ggplot to color code the species based on how endangered they were (using the IUCN scale for the meaning of the colors).
I used visual studio code, HTML, CSS, Javascript and Github to compose this website.
(click a territory on the map to see the % of bycatch from that territory classifed as threatened species.)
To make this map, I first used R studio to organize CSV Data and tell me the total number and distribution of species caught in each fishing territory (except for ICCAT, as the data needed is not fully assembled for that region yet.)
I then typed up the results of this data (being the % of bycatch classified by the IUCN as threatened) and paired it to thier respective territories, on an interactive map of the fishing territories I had drawn through google's "My Maps" application.
Maps and infographics by Megan Penland. Data analysis by Melissa Cronin.